Connection Runs
The Connection Runs screen centralizes all your connection runs across all your connections. Here, you can monitor and review detailed logs, statuses, and potential issues for each run. This page helps you track data movement, identify errors, and ensure your connections are running smoothly.
The Connection Runs screen provides a centralized view of all your connection runs across your integrations. For each connection run, you can see:
- Source – The data source of the connection.
- Destination – Where the data is being sent.
- Start Time – When the run started.
- Duration – How long the run took.
- Status – The current state of the run (e.g., Success, Failed).
- Records – The number of records processed.
Additionally, you can:
- Expand any run to view the full log for detailed insights.
- Use filters to customize your view and focus on the most relevant connection runs.
Network Logs
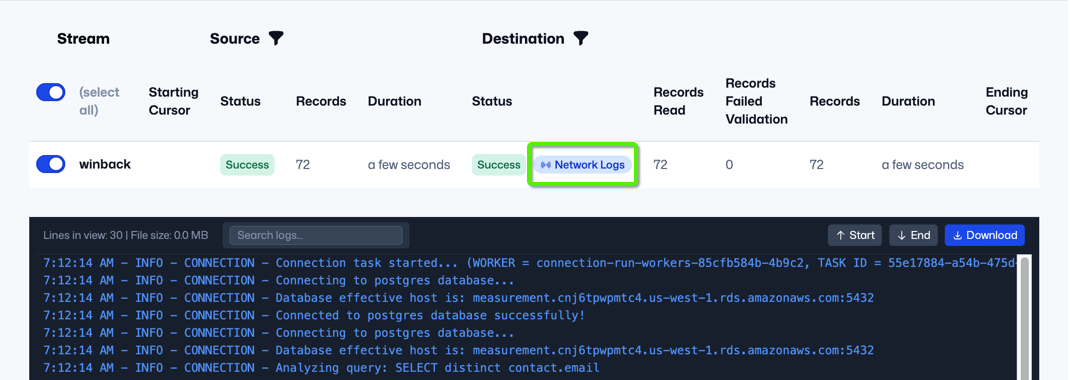
For stream runs that captured HTTP activity, Extract shows a Network Logs button directly in the stream table on the connection run details screen. This gives you request-by-request visibility into how the selected source or destination interacted with an API during that stream run.
How to open Network Logs
- Open the connection run you want to inspect.
- In the stream table, find the stream you want to review.
- Click Network Logs next to the Source or Destination status badge.
- The panel opens on the right side of the screen and defaults to the side you selected.
You can switch between Source and Destination tabs inside the panel when both sides have captured logs. These are separate log views for the same stream run.
What you can inspect
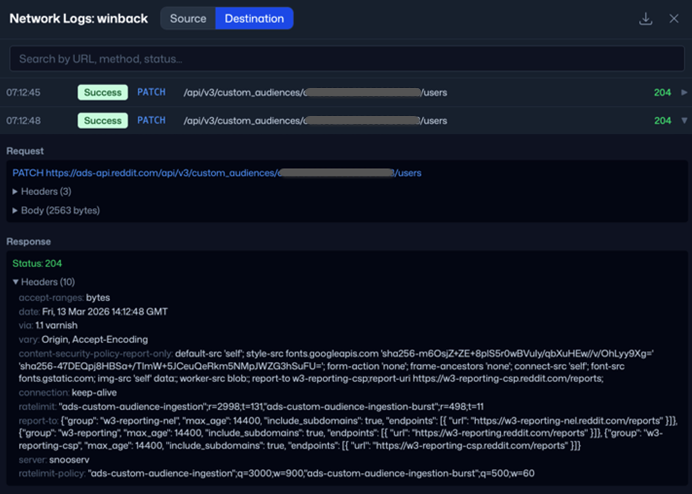
Each log row gives you a compact summary first, including:
- The request time
- A status badge for the log entry
- The HTTP method
- The request path
- The response status code, when a response was recorded
Select a row to expand it and inspect the full entry. Depending on what was captured, the expanded view can include:
- Logged context for the request
- Error details
- Full request URL
- Request headers
- Request body
- Response status
- Response headers
- Response body
When the request or response body contains valid JSON, Extract formats it for easier reading.
Search and download
Use the search box at the top of the panel to narrow the results. Search runs on the server after a short delay of about half a second, so Extract does not reload results on every keystroke.
Search is applied to the full raw log entries, not only to the fields currently visible in the collapsed list. This helps you find entries by values such as URL fragments, HTTP methods, status codes, or other logged content.
Results are shown in pages of 100 entries. Use Prev and Next at the bottom of the panel to move through the log.
Use the download button in the panel header to export the full raw log for the currently selected tab as a .jsonl file.
- If your search does not match any entries, the panel shows a no-results state.
- If the panel cannot load the logs, it shows an error state instead of the log list.
- Not every connector or every run produces network logs, so availability will vary by stream run and by source or destination side.